Attention readers of BEA’s official blog: On Aug. 15, 2018, we moved our blog, now called The BEA Wire, to https://www.bea.gov/news/blog as part of a broader update to our website. New blog entries are no longer posted to BEA’s now-dormant WordPress site blog.bea.gov, which will go dark after March 2019. Archived blog content is available on www.bea.gov.
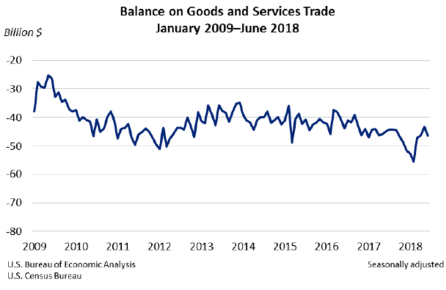
The U.S. monthly international trade deficit increased in June 2018 according to the U.S. Bureau of Economic Analysis and the U.S. Census Bureau. The deficit increased from $43.2 billion in May (revised) to $46.3 billion in June, as exports decreased and imports increased. The previously published May deficit was $43.1 billion. The goods deficit increased $3.1 billion in June to $68.8 billion. The services surplus decreased less than $0.1 billion in June to $22.5 billion.
Exports
Exports of goods and services decreased $1.5 billion, or 0.7 percent, in June to $213.8 billion. Exports of goods decreased $1.7 billion and exports of services increased $0.2 billion.
• The decrease in exports of goods mostly reflected decreases in consumer goods ($1.4 billion); in capital goods ($0.9 billion); and in automotive vehicles, parts, and engines ($0.7 billion). An increase in industrial supplies and materials ($2.0 billion) partly offset the decreases.
• The increase in exports of services mostly reflected an increase in financial services ($0.1 billion).
Imports
Imports of goods and services increased $1.6 billion, or 0.6 percent, in June to $260.2 billion. Imports of goods increased $1.4 billion and imports of services increased $0.2 billion.
• The increase in imports of goods mostly reflected increases in consumer goods ($2.0 billion) and in industrial supplies and materials ($0.9 billion). A decrease in capital goods ($1.5 billion) partly offset the increases.
• The increase in imports of services mostly reflected an increase in charges for the use of intellectual property ($0.3 billion), which included payments for the rights to broadcast the portion of the 2018 soccer World Cup that occurred in June.
For more information, read the full report.

Personal income increased 0.4 percent in June, the same increase as in May. Wages and salaries, the largest component of personal income, increased 0.4 percent in June after increasing 0.3 percent in May.
Current-dollar disposable personal income (DPI), after-tax income, increased 0.4 percent in June, the same increase as in May.
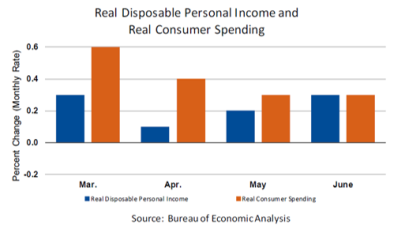
Real DPI, income adjusted for taxes and inflation, increased 0.3 percent in June after increasing 0.2 percent in May.
Real consumer spending (PCE), spending adjusted for price changes, increased 0.3 percent in June, the same increase as in May. Spending on durable goods increased 0.4 percent in June after increasing 0.6 percent in May.
PCE prices increased 0.1 percent in June after increasing 0.2 percent in May. Excluding food and energy, PCE prices increased 0.1 percent in June after increasing 0.2 percent in May.
Personal saving rate
Personal saving as a percent of DPI was 6.8 percent in June, the same as in May.
For more information, read the full report.

You must be logged in to post a comment.